This report uses gridded data from the ECMWF ERA5 global reanalysis [1] for a brief outlook of the meteorological evolution associated with the July 2021 floods in central Europe [2]. Hourly precipitation data are retrieved on a 1°x1°latitude-longitude horizontal grid for the period from 1/1/1979-25/7/2021. Standard upper-air fields (wind, geopotential, potential vorticity) are retrieved on 2°x2° horizontal (1°x1° for potential vorticity) and 6-hourly temporal resolution for the same period.
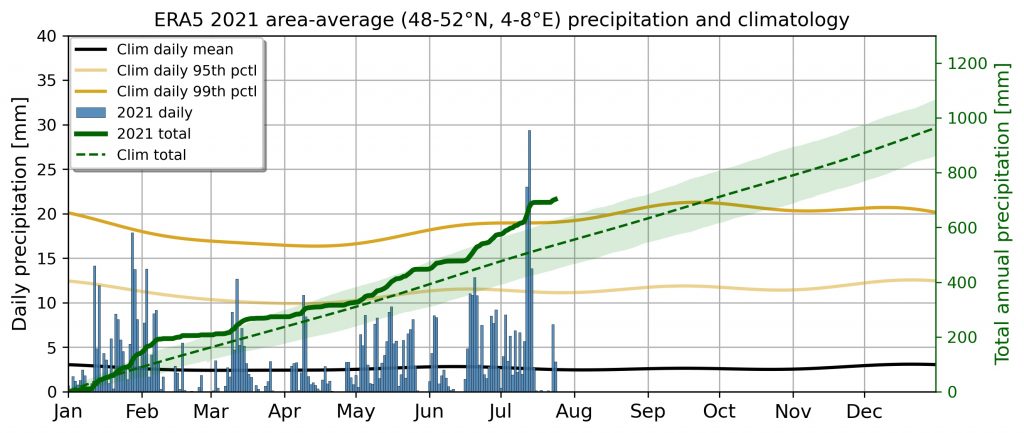
Figure 1 shows the 2021 daily precipitation (24-hour sum) average over an area of central Europe (48-52°N, 4-8°E) that was hit hard during the mid-July floods. This area comprises parts of western Germany (Rhineland-Palatinate, Saarland, North Rhine-Westphalia), eastern France (Grand Est), and Benelux. The period between 12 and 14 July recorded exceptional amounts of rainfall, with the first two days far exceeding the 99th percentile and the third one exceeding the 95th percentile. This episode caused many rivers and streams to burst their banks and landslides to occur with devastating results for nearby buildings and infrastructure. A key aspect in this regard was the fact that prior to this episode the year had been significantly “wetter” than normal. Figure 1 reveals that in early July the 2021 precipitation accumulation was already more than one standard deviation above the norm (i.e., above the climatological mean cumulative annual precipitation for early July). Most of this excess precipitation appears to be the result of a series of above-average rainfall events from mid-June onward.
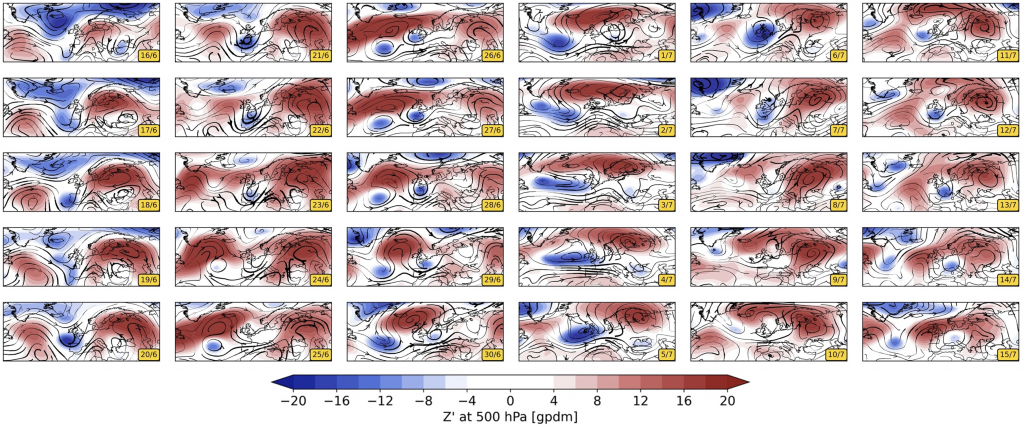
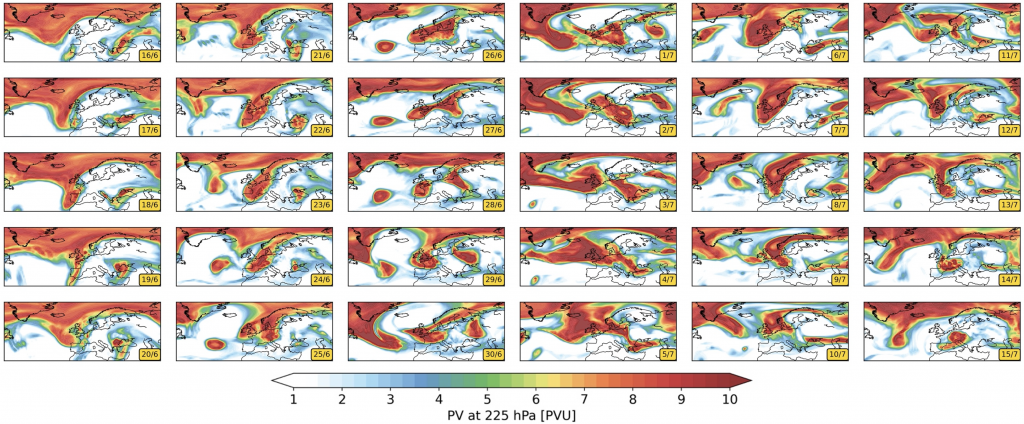
Investigating the evolution of basic meteorological upper-air fields in the period from mid-June to mid-July 2021 may shed some light on the weather-related causes of the catastrophic mid-July floods. Figure 2 shows the evolution of geopotential height anomaly (defined as the deviation from a smoothed annual cycle) and wind at 500hPa. Figure 3 shows the corresponding evolution of potential vorticity (PV) at 225hPa, an isobaric level that crosses the tropopause over central Europe during summer. Collectively, the evolution of these fields reveals that the period in question saw a persistent high-pressure system over NE Europe while a series of low-pressure systems moved across the N Atlantic toward western Europe (Fig. 2). These low-pressure systems were associated with a highly dynamic tropopause. The persistent highs in N and NE Europe are evident in the PV field, which reveals the occurrence of wave breaking upstream and the subsequent formation of PV-streamers and cut-offs that provided dynamical forcing for the rainfall events in central Europe. Moreover, the southern tip of these elongated features reached the Mediterranean and may have been crucial in modulating moisture transport towards the affected regions.
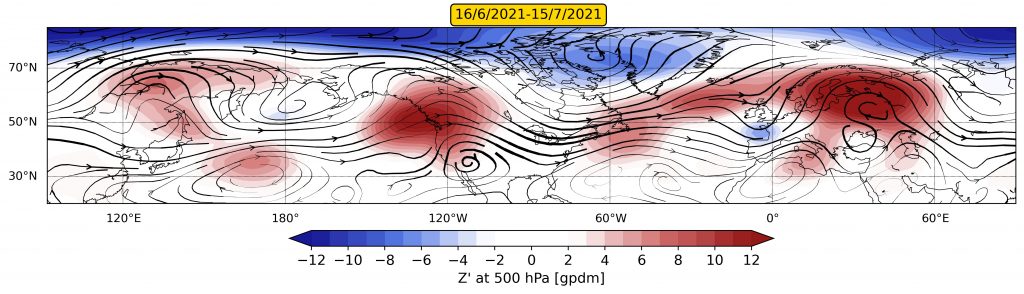
It is worth noting that anomalous weather regimes in this period affected a big part of the Northern Hemisphere. Figure 4 shows the mean geopotential height anomaly and wind field at 500hPa during the period from June 16th to July 15th. The dominant flow patterns that “survive” this 30-day averaging imply that the large-scale circulation in this period had a recurrent component. In this 30-day perspective, NE Europe appears to be under the influence of a dipole-block with record-high temperatures registered in Finland and Russia [3,4], while a low-pressure regime characterizes western Europe leading to the aforementioned rainfall episodes. Another dominant pattern of this period was the strong ridge over western N America which resulted in a record-breaking and deadly heat wave [5]. Although the mechanisms driving such recurrent flow anomalies at beyond-weather spatiotemporal scales remain unclear, it appears plausible that the extreme events of this period were not secluded but rather tele-connected by anomalous undulations in the jet stream across several thousand kilometers and days.
References:
[1] Hersbach, H, Bell, B, Berrisford, P, et al. The ERA5 global reanalysis. Q J R Meteorol Soc. 2020; 146: 1999-2049. https://doi.org/10.1002/qj.3803